
…Sprint Planning has ended, the Production Episode has started, and the Development Team is fully engaged.
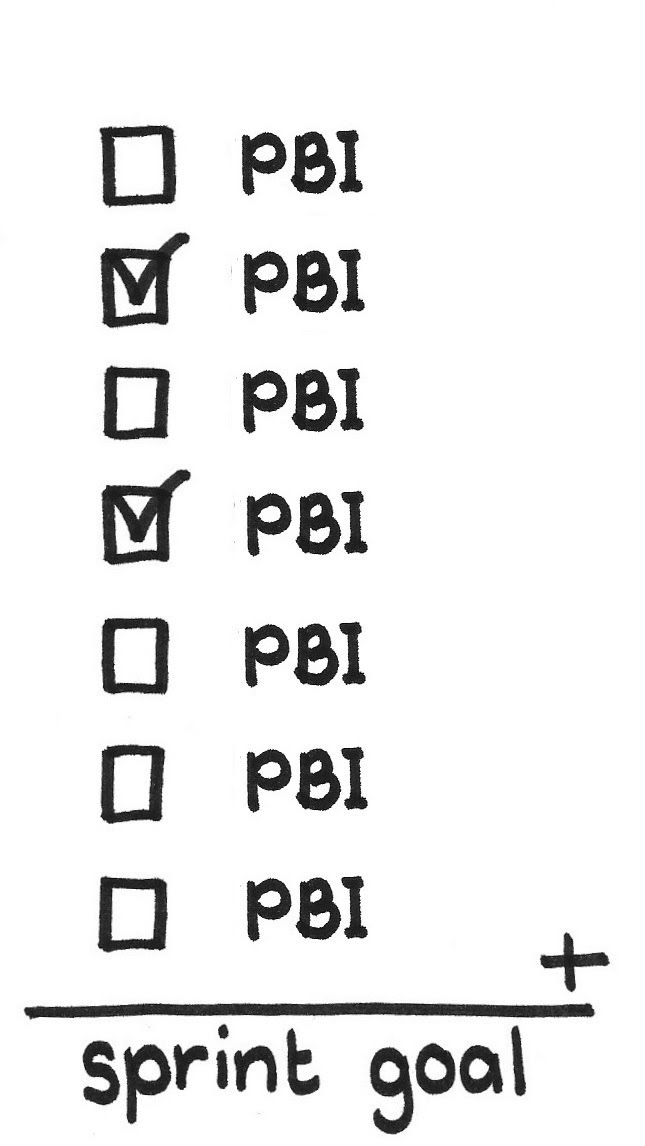
Based on its understanding of its capacity, its velocity (see Notes on Velocity) and its estimate of the effort required to develop the top Product Backlog Items (PBIs), the Development Team has agreed to a Sprint Goal and created its development and construction plan in the form of a Sprint Backlog.
The Development Team is committed to the Sprint Goal, and to doing everything it can to complete the PBIs that it forecast it would complete in this Production Episode time box.
✥ ✥ ✥
The Development Team members focus most of their attention on technical, production, and engineering tasks, but they must also attend to business issues as a self-managing team (see Autonomous Team). It is important that team members have timely access to information about their progress towards meeting their forecast, so that they can pivot immediately if necessary.
There are too many unknowns for the team’s delivery forecast to be a guarantee, and yet the statement of the Sprint Goal and the team’s forecast delivery have raised stakeholders’ expectations.
The Development Team needs a clear understanding of its estimated remaining work on a frequent, perhaps daily, basis so it can manage its progress during the Sprint.
If it turns out that the Development Team has overestimated its capacity for work, the Scrum Team needs to be able to communicate this to stakeholders (perhaps directly, perhaps through the Product Owner) as early as possible. It may even be necessary to escalate into Emergency Procedure, so that the Scrum Team, and possibly the business and customers, can collaborate to find a solution.
If, on the other hand, the Development Team turns out to have significantly overestimated the effort needed to turn PBIs into a potentially shippable increment, then it will have spare capacity at the end of the Sprint. The Scrum Team as a whole needs to decide how best to use that capacity.
This might cause the Product Owner to pull forward PBIs, originally slated for the next Sprint, for development in the current Sprint (or, by agreement, the Developers can just continue working from the top of the Product Backlog). The Development Team can update its work plan accordingly in the Daily Scrum. (And the Developers and Product Owner together probably have some work to do the next time they work toward a Refined Product Backlog.)
It would be very useful to forecast which of these fates await the Development Team at the end of the Sprint, and to make that information transparent to stakeholders.
Therefore:
Create a graph that plots estimated work remaining in the Sprint against the amount of time remaining in the time box. Plot the Sprint’s progress as a trend line on the graph so that its slope gives an immediately obvious and intuitive indicator as to likelihood of the Development Team meeting its target. Post the graph where all Scrum Team members have easy access to it. Update it regularly, at least on a daily basis.
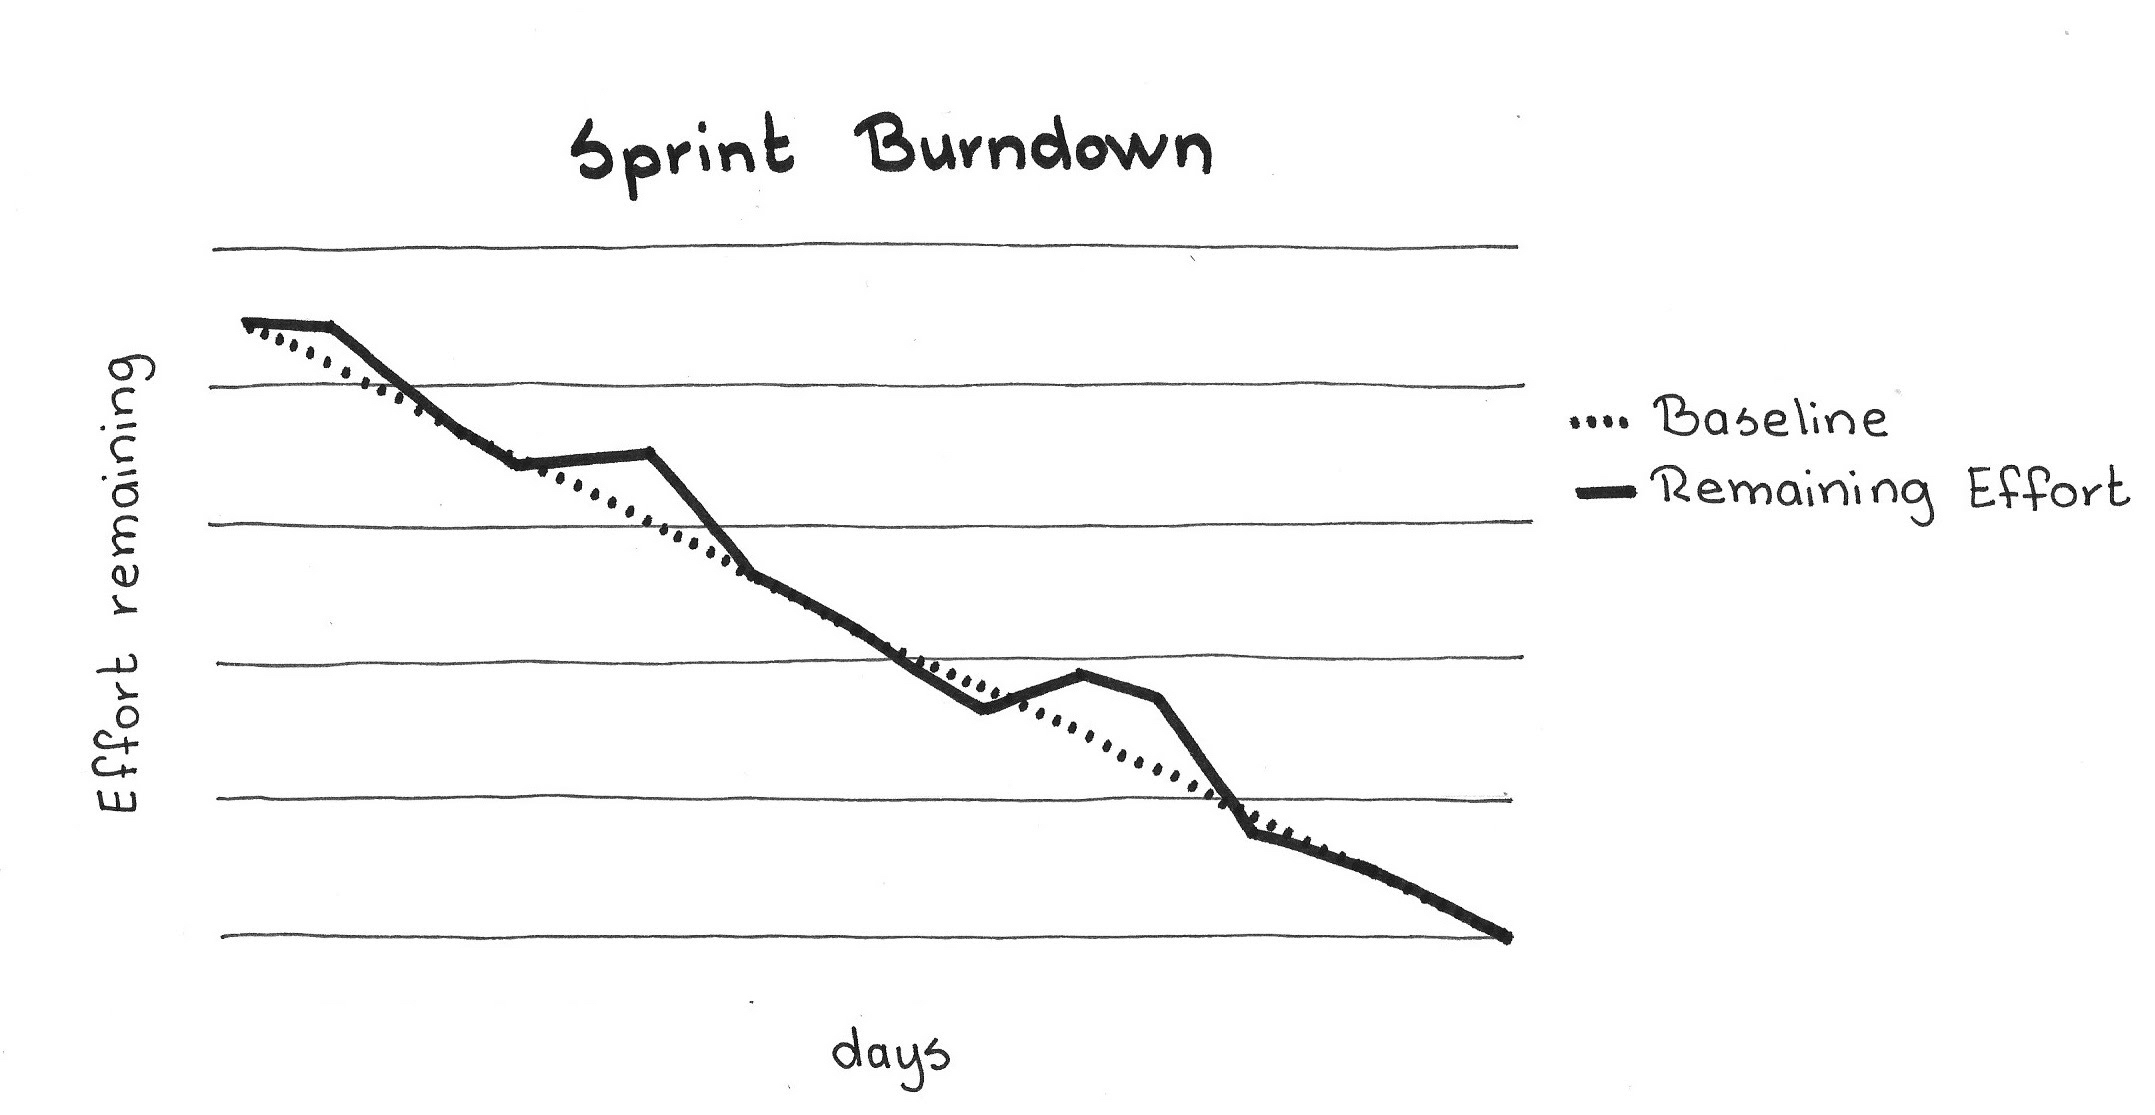
This graph is called a Sprint Burndown Chart, or Sprint Burndown Graph.
The concept of the Sprint Burndown Chart is an analogy drawn from the experiences of pilots trying to land high-performance fighter aircraft. It is designed to detect when the plane is high on the glide path. It also shows distance to the end of the runway, rate of descent, and is an indirect indication of airspeed and direction. When the plane is high on the glide path it is often necessary to abort the landing. If the pilot tries to drop more quickly by pulling the nose up and reducing power, he or she can get behind the power curve, where going slower requires more power and causes a crash. (This is analogous to Brooks’ Law in [1] that says adding people to a late project makes it later). However, a good pilot who detects the problem early enough can take safe and effective action to land the plane on the end of the runway. Poor pilots may try to land anyway and touch down beyond the end of the runway. On an aircraft carrier, this can destroy the airplane and often the pilot.
In a Sprint Burndown Chart, the Y-axis reflects the overall effort estimated to achieve the forecast. The unit of measurement should be the same as that used to estimate the PBIs (i.e., Estimation Points).
The X-axis shows the number of working days left in the Sprint. The graph depict a countdown of working days to 0 (the last day of the Sprint), or calendar dates (i.e., January 4, March 5, etc.) or how many days have passed in the Sprint.
The Development Team owns the Sprint Burndown Chart. It is a tool originally intended for use by the Development Team rather than by external stakeholders—management included. However, in broad use it is a popular Information Radiator that gives a wider audience transparency into what is happening inside the Production Episode: there is no need to hide anything in Scrum, and transparency can sometimes lead to early impediment detection and resolution. But it is there primarily to help the team manage itself, rather than to provide information to any other party managing development.
In developments using a Sprint Burndown Chart, the ScrumMaster may need to remind the Development Team to update it regularly, and to lead the team towards choosing a format that most clearly and easily expresses its intent.
Since value is directly associated with PBIs rather than with Sprint Backlog Items, the team should track work remaining at the level of the PBIs to be delivered. As the team completes work items, they decrement the overall amount of work remaining, and plot the new total on the graph. Here, “completed” is best interpreted as Done (see Definition of Done), which implies that the team updates the chart only when a PBI is brought to Done. Tracking Done keeps the team attentive to progress on delivering the Sprint value. If the graph were to instead depict completion of Sprint Backlog Items, then it would display how much work remains. It is in theory possible to complete almost all work and deliver little or no value if the work on most PBIs remains incomplete.
The team marks off the estimated work for completed items, rather than the actual expended effort; we do not want and do not need the tedium of measuring time taken by individual tasks or PBIs. Update the Sprint Burndown Chart in only two cases. In the first case, the team updates the chart when a PBI comes to Done, burning down by that PBI’s original estimated effort. The second case relates to the discovery of emergent requirements and unplanned work. One might increase the PBI estimate accordingly and adjust the chart upward by the delta of newly discovered work. Do not reduce the amount of remaining work for a partially completed PBI. The job of the Sprint Burndown Chart is to focus the team forward on remaining work in the days left in the Sprint rather than looking back to the past, however recent. The accuracy of the estimate for any given item does not normally affect the estimates for the remaining items.
There is a strong benefit in maintaining the chart on a wall, as a hand-drawn poster, rather than outsourcing it to a tool. On the one hand, it strengthens the Development Team’s sense of ownership to physically draw the trend line, and on the other hand there is pressure to keep it simple, focusing on only the essential information the Development Team needs. It is not easy to hide a wall poster, either purposefully or by accident. The Sprint Burndown Chart becomes a powerful tool for reinforcing self-management in these circumstances. You can also easily annotate the Sprint Burndown Chart with important events and use those data during the Sprint Retrospective.
Most Burndown Charts include a reference line for the average burndown rate, drawn from the top of the Y-axis (effort) to the right-most calibration mark of the X-axis (time). The team can compare the trend line of the Sprint’s actual progress against the reference line. If the team finds its progress is significantly above the average burndown rate, then it may conclude it is likely to not deliver the entire Sprint Backlog. If, on the other hand, it is significantly below the average trend line, the Development Team may conclude it has spare capacity in the Sprint. A less simplistic approach would compare the current Sprint’s trajectory against the trajectory for recent Sprints, because the burndown path is rarely linear.
✥ ✥ ✥
Some Development Teams use graphs that show the effort needed to complete tasks rather than PBIs and some use a “double y-axis” with both PBIs and tasks shown, with a different colored trend line for each on the same Burndown Chart.
The Development Team is free to choose whatever representation suits its needs best, but it should realize that most often not all development tasks are known at the end of Sprint Planning. New tasks emerge as the team learns more during the Sprint, meaning it should increase the amount of remaining work as described above. The Development Team should focus on how much they will deliver rather than on how much work they have done. Moreover, it is possible for the Development Team to have completed a great number of tasks without actually delivering much value.
This should never be true of PBIs, assuming no new ones are allowed to enter the Sprint (unless the team has already achieved the Sprint Goal). Since the PBIs represent the essential value propositions of the Sprint Goal, the trend line on a Sprint Burndown Chart—which focuses on the effort estimated to develop the PBIs—keeps the team centered on its delivery of business value.
Ken Schwaber was the first to describe the Sprint Burndown Chart in May 2001. He invented it during his period at Fidelity Investments. [2]
[1] Fred Brooks. The Mythical Man Month. Reading, MA.: Addison Wesley, 1975 and 1995.
[2] Ken Schwaber. “Sprint Burndown.” Web.archive.org, http://web.archive.org/web/20010503112119/www.controlchaos.com/sburndown.htm, May 2001 (accessed 2 November 2017).
Picture credits: U.S. Navy photo by Erik Hildebrandt, 170728-N-UZ648-093 (public domain).